Demand for furnished apartments in Dubai returned to growth in the first half of 2026, with searches rising around 5 per cent year on year by June, according to Property Finder data. The recovery followed a softer start to the year and built steadily through the two quarters.
“By June, the typical budget renters were searching within had eased to around AED 82,000, so as demand rebuilt, it did so at more attainable levels. That points to a broadening, deepening rental market rather than a price-driven squeeze, which is a healthy sign for renters and investors alike,” Cherif Sleiman, Chief Revenue Officer at Property Finder said in a statement.
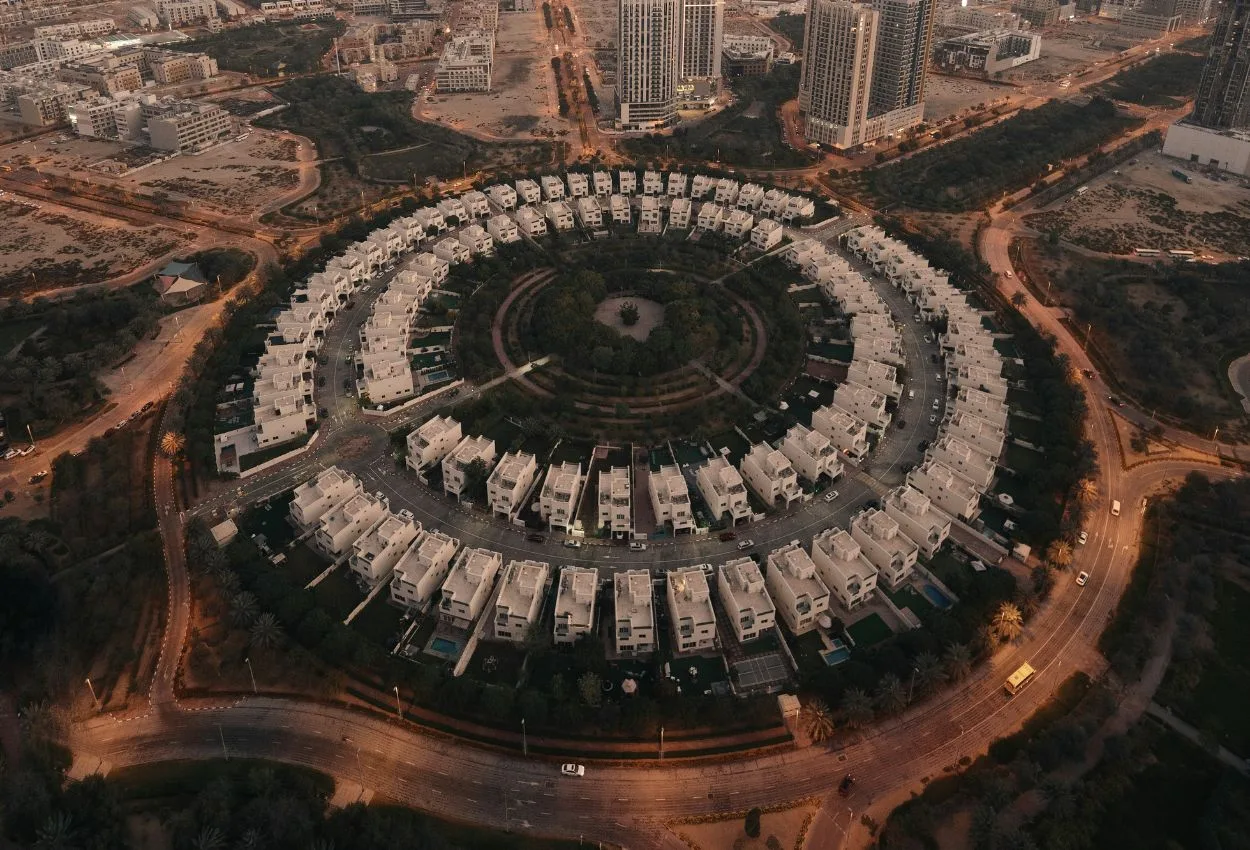
Jumeirah Village Circle led the market by search volume across H1, with a typical budget of around AED 75,000, the most accessible of the leading communities.
Studios and one-bedroom apartments dominated there, accounting for 32.5 per cent and 54.6 per cent of searches respectively – close to 90 per cent combined – consistent with a market built around smaller, efficient homes.
Business Bay sat a tier above, with a stable typical budget of around AED 100,000. One-bedroom units led at 53.7 per cent of searches, the preferred configuration for professionals prioritising proximity to work, while studios and two-bedroom apartments each accounted for roughly 22 per cent.
Downtown Dubai occupied the premium end at a typical budget of around AED 140,000, and was the only major community where larger units led demand. Two-bedroom apartments were the most sought-after at 37.5 per cent, narrowly ahead of one-bedrooms at 36.5%, with three-bedroom homes making up 14.1 per cent of searches.
Sleiman described the renter profile across these communities as a “highly mobile, professional population” wanting a home they can move into immediately, without the cost or effort of furnishing it.
Whether that appetite is drawing spend away from hotels is harder to isolate from search data alone, he noted, but for anything beyond a short stay, furnished apartments offer space and value a hotel room typically does not.
| Timeline | Furnished Apartment Rental Searches 2025 | Furnished Apartment Rental Searches 2026 | YoY % | Buyer Average Annual Budget 2025 | Buyer Average Annual Budget 2026 | YoY % |
|---|---|---|---|---|---|---|
| January | 270,725 | 244,148 | -9.8% | 90,000 | 100,000 | 11.1% |
| February | 245,978 | 202,426 | -17.7% | 90,000 | 105,000 | 16.7% |
| March | 242,348 | 121,890 | -49.7% | 90,000 | 95,000 | 5.6% |
| April | 229,026 | 149,467 | -34.7% | 90,000 | 91,500 | 1.7% |
| May | 305,515 | 254,611 | -16.7% | 90,000 | 87,500 | -2.8% |
| June | 272,786 | 286,596 | 5.1% | 90,000 | 82,250 | -8.6% |
| Q1 2026 | 759,051 | 568,464 | -25.1% | 90,000 | 100,000 | 11.1% |
| Q2 2026 | 807,327 | 690,674 | -14.4% | 90,000 | 87,500 | -2.8% |
| H1 2026 | 1,566,378 | 1,259,138 | -19.6% | 90,000 | 90,000 | 0% |